Wadden Sea Seal Monitoring
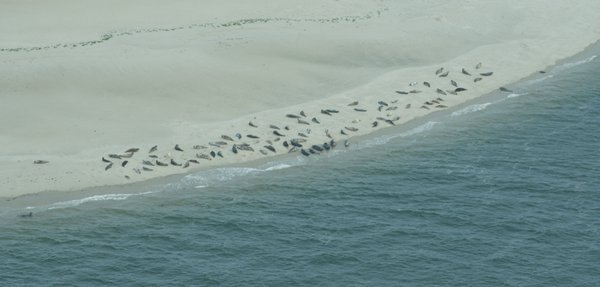
Automated seal population monitoring system using AI to count, classify, and identify individual seals from aerial imagery in the Wadden Sea.
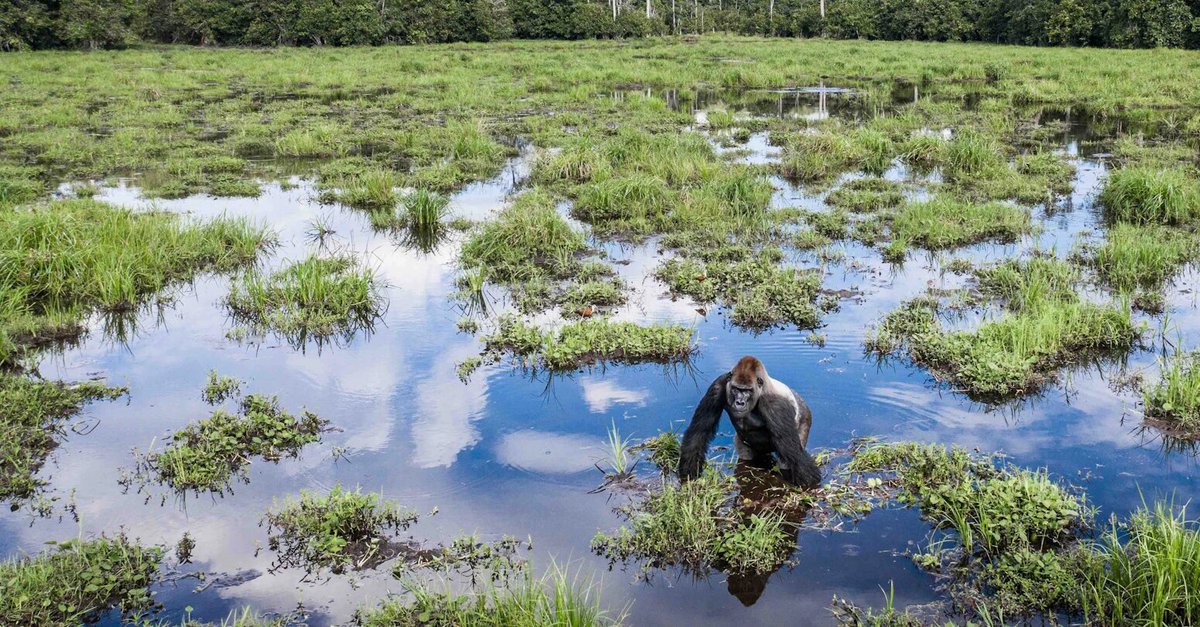


Backend engineering with the EarthRanger team, so the platform behind 900+ protected areas stays fast as it grows.
In hundreds of protected areas around the world, the day starts the same way: someone opens EarthRanger and looks at the map. Where are the collared elephants? Which patrols are out? What happened overnight? EarthRanger is the operations platform behind that map, built and maintained by the team at Ai2, the Allen Institute for AI. In 2024, we joined its engineering team for a scaling mission: help the backend and its database keep up with a platform that protects more parks, more wildlife and more data every year.
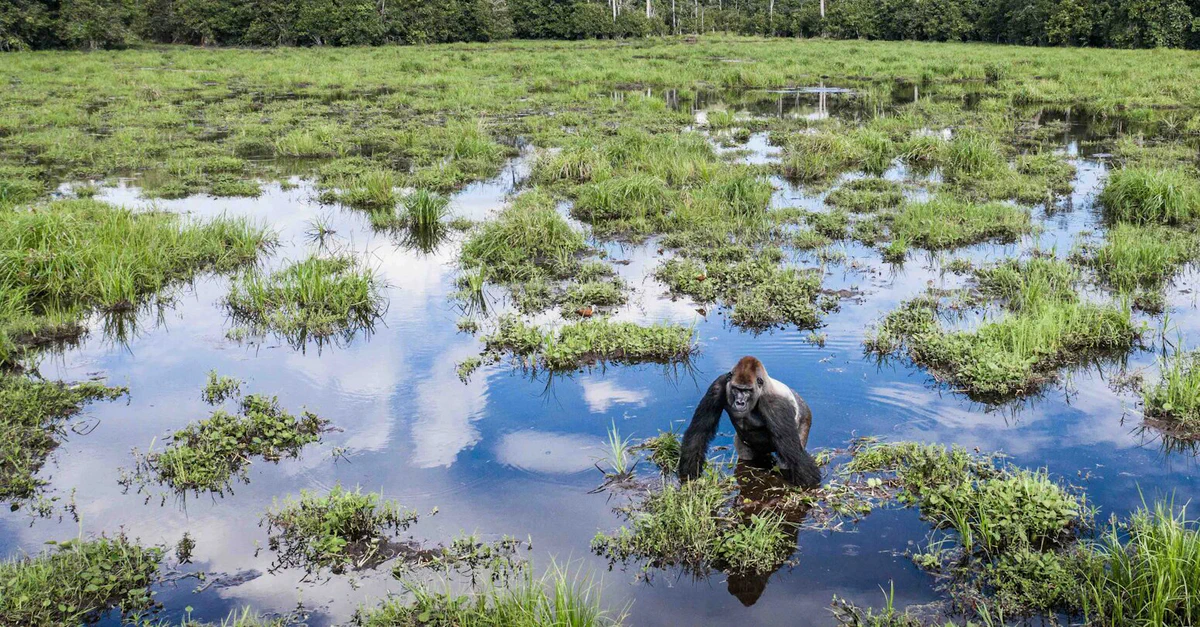
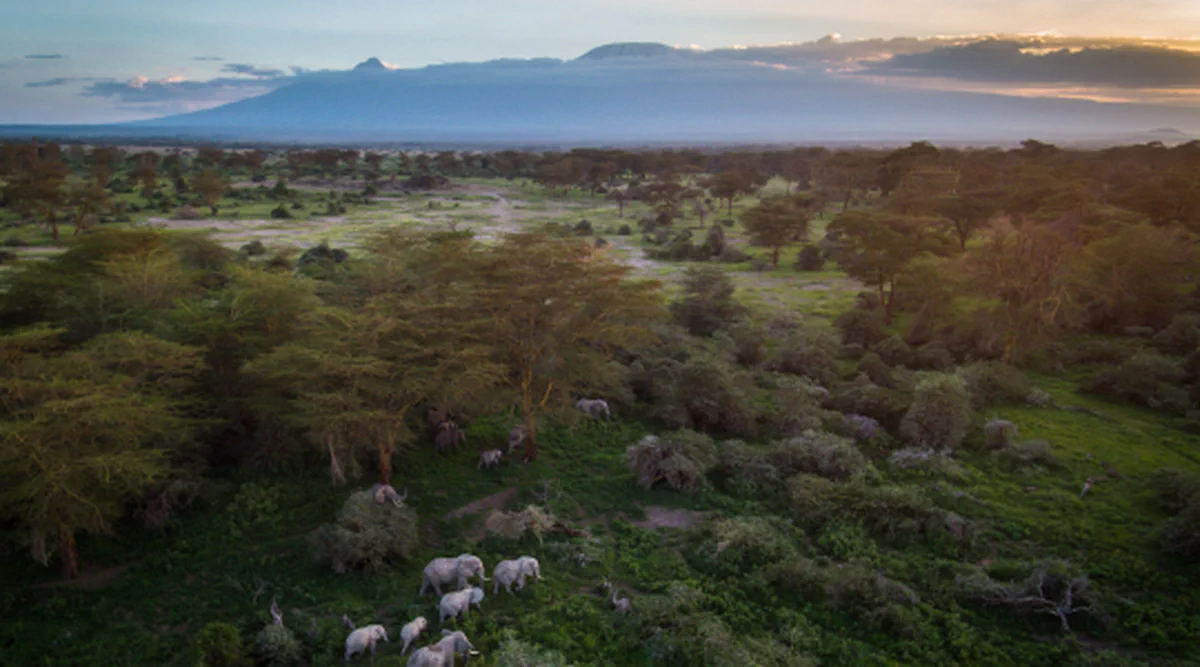
EarthRanger began with a crisis. The 2016 Great Elephant Census revealed that Africa’s savanna elephant population had fallen by 30% in just seven years, and the teams on the ground had no shared picture of what was happening in their own landscapes. Conceived by Vulcan together with Save the Elephants, and a program of Ai2 since 2021, EarthRanger set out to give protected areas what a modern operations room gives a city: every asset, every alert, every decision on one screen.
Today it is one of the most widely used conservation platforms in the world, free for the people using it, deployed at 900+ conservation sites in over 80 countries, tracking some 23,000 animals by GPS:
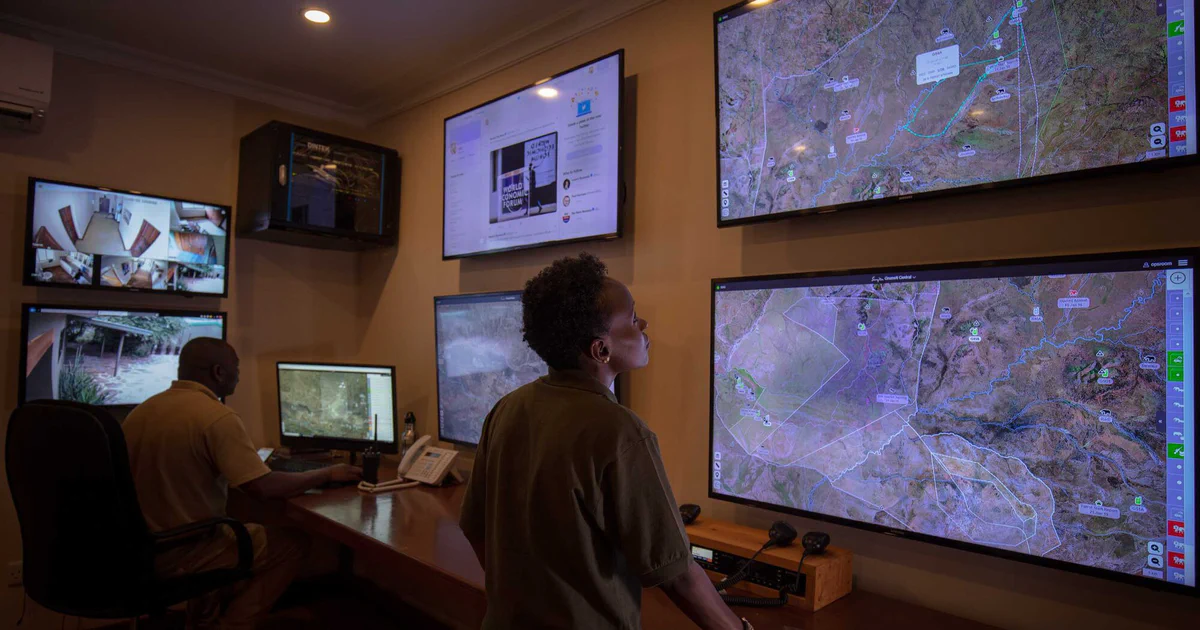
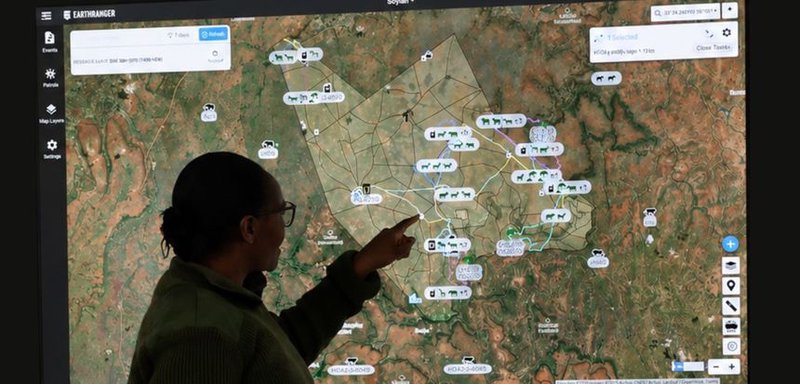
Wildlife, rangers, vehicles and sensors appear together in real time, giving managers a single operational picture of their protected area.
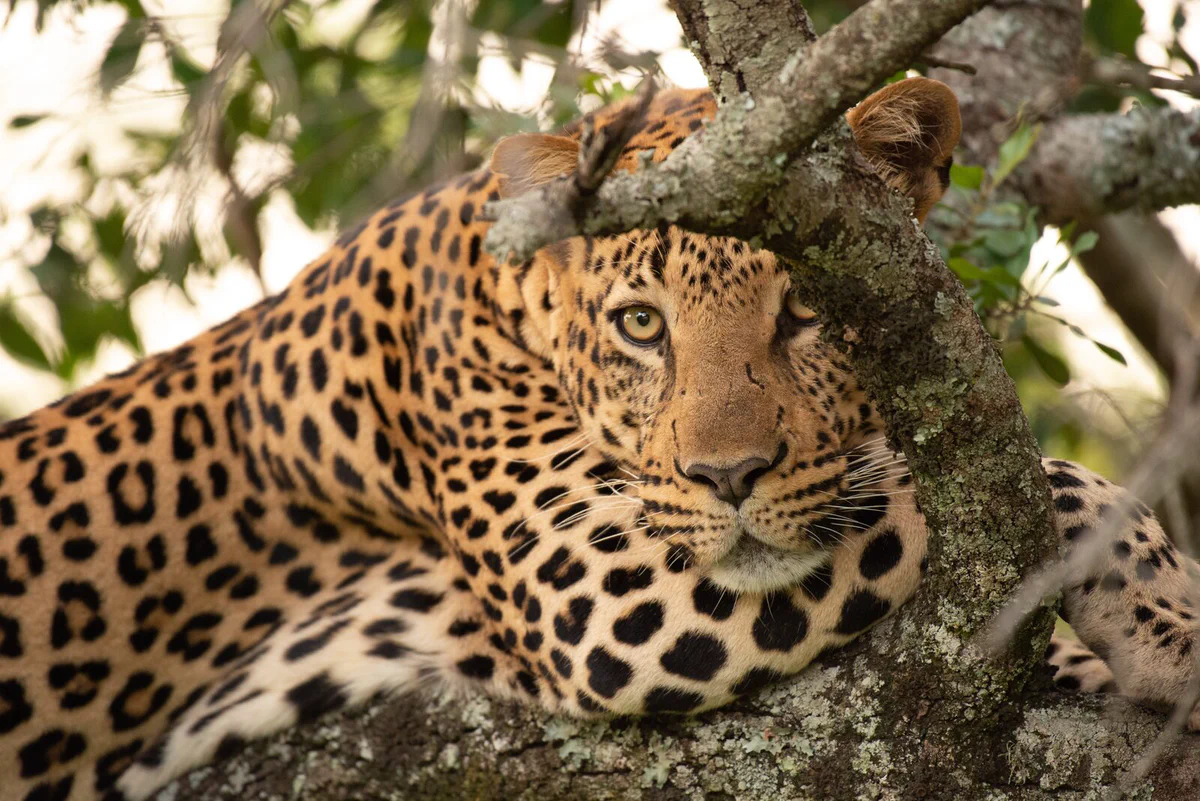
GPS collars and tags stream in the positions of elephants, rhinos, lions and dozens of other species, around the clock.
Patrols, incident reports and alerts flow through the platform, so teams can be dispatched to where they are needed most.
Camera traps, acoustic sensors, radios, satellite feeds and field apps all plug in, turning scattered devices into one data stream.
Dashboards, reports and analysis tools turn raw field data into the evidence behind anti-poaching, wildlife research and park management.
EarthRanger is free for conservationists, which is why its reach keeps growing, from national parks to community conservancies.
This is what that looks like day to day: a live map of the whole protected area, every tracked animal and patrol on it, and the day’s events one click away.
Success created its own engineering problem. A platform serving 900+ sites in real time is, underneath the map, a torrent of database traffic: every collar ping is a write, every dashboard a burst of reads, and both keep growing with every animal collared and every park onboarded. Tap each challenge to see why scaling it is hard.
Collars, sensors and radios never stop reporting. The database takes a constant stream of writes, day and night, from every time zone at once.
Every dashboard, map refresh and report is a read query landing on the same database that is busy ingesting live field data.
Years of observations and tracking points pile into enormous tables, and every query gets a little slower as they grow.
When a ranger team responds to an alert, a slow API is not an inconvenience, it is time lost on the ground.
Every newly onboarded protected area adds users, devices and data to infrastructure that has to keep feeling instant.
We worked inside EarthRanger’s backend alongside the Ai2 engineering team, on three fronts:
Route the two kinds of traffic down different paths, so heavy dashboard and analysis queries never compete with live field data being written.
Split the platform's largest tables into partitions, so each query touches only the slice of data it actually needs.
Profile the busiest endpoints and improve their latency and throughput, for faster maps, dashboards and integrations.
Put together, the work reshapes how a request travels through the platform:
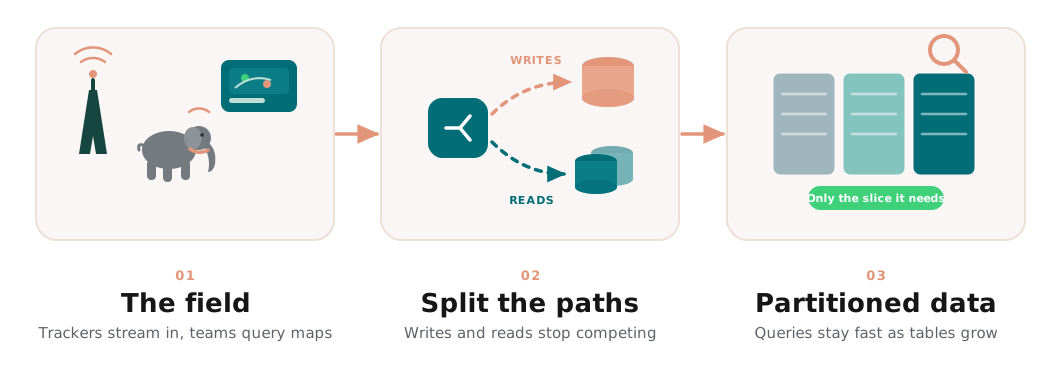 Field devices and dashboards generate constant traffic; writes and reads are
routed down separate paths, and partitioned tables keep every query touching
only the data it needs.
Field devices and dashboards generate constant traffic; writes and reads are
routed down separate paths, and partitioned tables keep every query touching
only the data it needs.
Separating reads from writes matters because the two workloads behave so differently. Writes are small, constant and non-negotiable: a collar reports where an animal is right now, and that position must land in the database. Reads are bursty and heavy: a manager opens a dashboard and the platform assembles months of history in one go. On a single path, the second kind of traffic gets in the way of the first. Once each travels its own path, a heavy report can never slow down live tracking.
Partitioning attacks the other axis of growth. EarthRanger’s history is its scientific value, years of positions, patrols and events, but in database terms that history is a handful of tables growing without limit. Splitting them into partitions means a query about last week reads last week’s slice, not half a decade of records, and the platform’s performance stops degrading as its archive deepens.
API performance is where users feel all of it. We profiled the endpoints that maps, dashboards and integrations hit hardest and reworked the slowest query patterns, lowering latency and raising the throughput the platform can sustain at peak.
The result is headroom. Faster maps and dashboards for the people using EarthRanger in the field, where response time is measured against a moving threat. A database that stays fast as its history grows instead of slowing with age. And a backend that can keep welcoming new parks, conservancies and partners without performance being the price of growth, so the platform’s reach can keep expanding to the places that need it.
We build conservation technology with partners in the field. Tell us what you're monitoring and we'll tell you what's possible.


Automated seal population monitoring system using AI to count, classify, and identify individual seals from aerial imagery in the Wadden Sea.
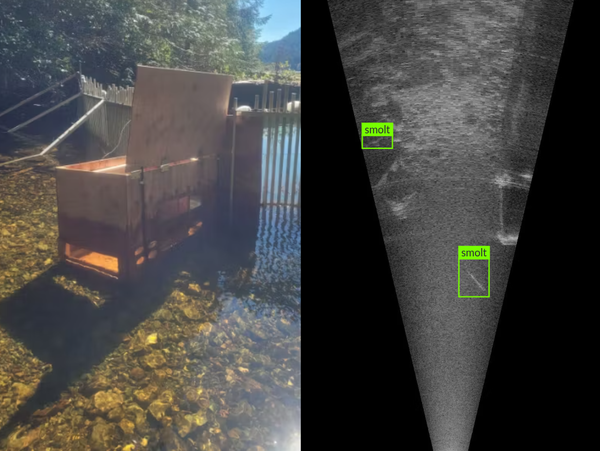
An innovative use of sonar imagery to monitor and analyze the migration patterns of smolt salmon as they journey from freshwater to the ocean
Democratize open and low-tech solutions for fighting wildfires, for the benefit of the ecosystems and the citizens.
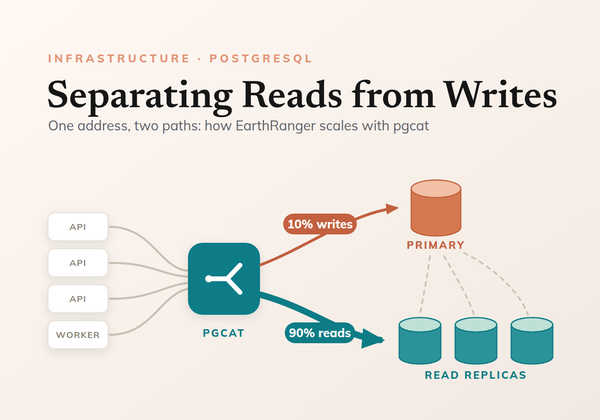
How we split read and write traffic on the EarthRanger backend with pgcat on Kubernetes and Cloud SQL read replicas, so the platform scales out with every new protected area.