



AI-BIRD (Automated Intelligence for Bird Inventory and Reproduction using Drones) is a web platform that turns drone imagery into bird surveys. Upload the photos from a flight over a colony and trained vision models detect every bird, classify each one, and produce georeferenced inventory maps and exportable reports, ready to compare from one survey to the next.
How It Works
A survey is one flight and a few clicks. The drone does the walking, the models do the counting.
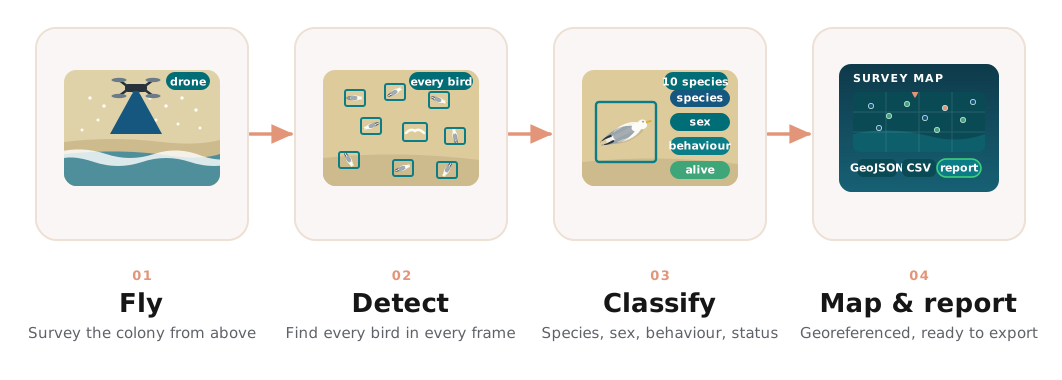 A drone flies the colony, every bird in the imagery is detected, each one is classified, and the results become a georeferenced map with an exportable report.
1. Fly the drone
Capture aerial imagery of your survey area with an off-the-shelf drone. No specialist hardware, and nobody has to walk through the colony.
2. AI detects and classifies
Upload the flight. Trained vision models find every bird in every frame, identify the species, and record sex, behaviour and whether the bird is alive.
3. Get maps and reports
Explore the georeferenced inventory map in the browser, then export detections and summaries in standard formats for your own analysis.
One Bird, Four Answers
Counting is only the start. For every bird it finds, AI-BIRD records four things, so a single survey tells you not just how many birds there are but who they are and how they are doing.
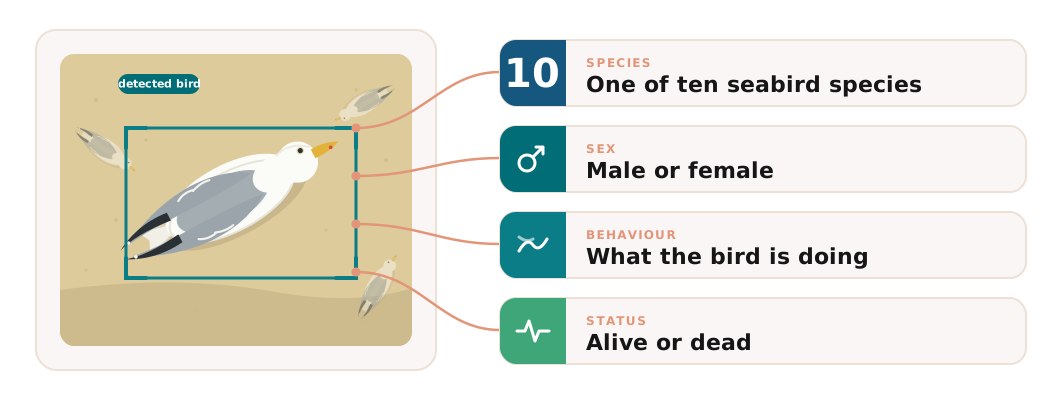 Every detection carries a species (one of ten seabirds), a sex, a behaviour and a status.
What AI-BIRD Does
Automated detection
Find every bird in your imagery without manual counting, frame after frame, survey after survey.
Species classification
Identify ten seabird species automatically with trained vision models, plus sex, behaviour and whether each bird is alive.
Geospatial maps
Turn detections into georeferenced inventory maps, so every bird has a place as well as a label.
Reproducible surveys
Re-run the same pipeline on the next flight for consistent, comparable results across the season and across years.
Exportable reports
Download detections and summaries in standard formats and carry them into your own GIS or statistics workflow.
Avian influenza monitoring
The flagship use case: survey colonies for outbreak and mortality signals without setting foot among the birds.
Flagship Use Case: Avian Influenza
Highly pathogenic bird flu can tear through a dense seabird colony in days. Because a drone survey is fast and disturbs nothing, it can be repeated as often as an outbreak demands, and the alive-or-dead status on every detection turns each flight into a mortality count.
Count the colony without entering it
Walking a colony to count by hand disturbs nesting birds, risks trampling eggs and rarely covers everything. A drone flight covers the whole colony in minutes and can be flown again next week.
- Whole-colony coverage in a single flight
- No disturbance to nesting adults or chicks
- Safe to repeat through the breeding season
Read the outbreak in the numbers
Every bird is flagged alive or dead and placed on the map, so a survey shows where mortality is clustering and how it moves. Comparing flights over time reveals survival and reproduction, not just a headcount.
- Mortality mapped, not just totaled
- Survey-to-survey comparison on one pipeline
- Early warning for conservation response
Read about the bird flu monitoring project
AI-BIRD grew out of our work with Lumax AI on monitoring avian influenza in seabird colonies. The project page covers the threat, the field context, and how the survey pipeline came together.
Bird Flu Monitoring projectReady to survey from the sky?
Tell us about your colony and your survey needs, and we will set you up with a demo of the platform.